




D
Deleted member 16462
Exponent
- Joined
- Dec 9, 2021
- Posts
- 1,987
- Reputation
- 2,690
I observed 79 individuals over an hour enter into the library, all of them college-age. I measured 5 variables for each observation, 2 quantitative: time, PSL. 3 categorical: wearing a backpack, ethnicity, and gender.
I expected PSL to be higher in whites, and I expected the mean for whites to be about 4. I also expected people who wore backpacks to have lower PSL.
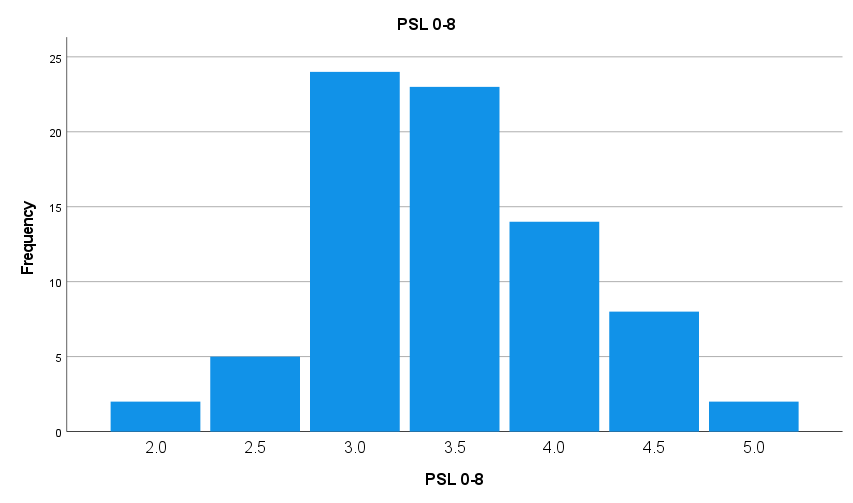
Here was the distribution of PSL for all observations. Considering this was a library might explain the low mean. Only 2 HTN or 5psl were observed. One white and one middle-eastern, (but looked white)
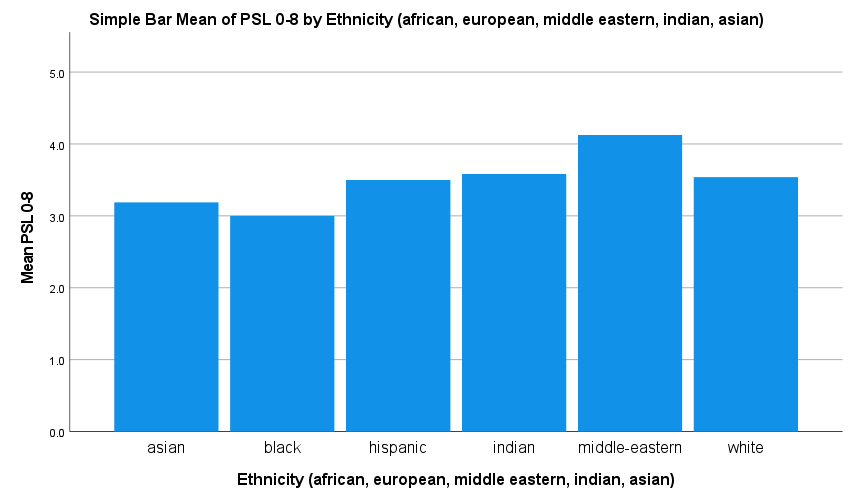
Here is the PSL by ethnicity, that one HTN messed up the distribution for the Middle Easterns. Also a cute Indian girl for Indians.
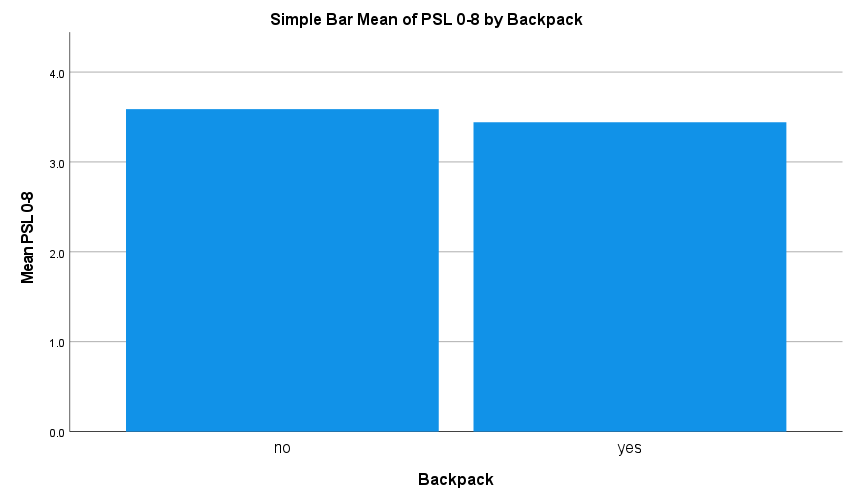
The PSL distribution for wearing a backpack. It is only slightly higher for non-wearers.
And finally PSL by gender
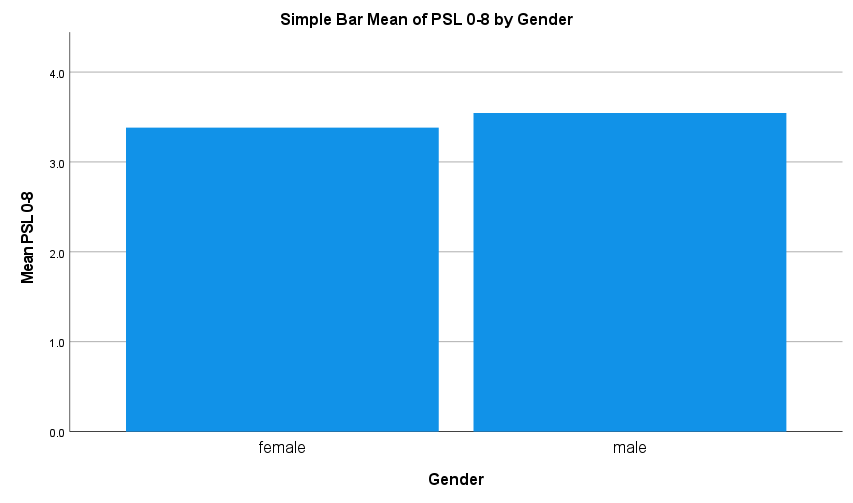
In conclusion, the mean PSL was between 3 and 3.5, which was lower than I expected. Disregarding outliers PSL would have been highest in whites but only by a small margin to other ethnicities, of course, I did not include an ethnic tax in my ratings.
I expected PSL to be higher in whites, and I expected the mean for whites to be about 4. I also expected people who wore backpacks to have lower PSL.
Here was the distribution of PSL for all observations. Considering this was a library might explain the low mean. Only 2 HTN or 5psl were observed. One white and one middle-eastern, (but looked white)
Here is the PSL by ethnicity, that one HTN messed up the distribution for the Middle Easterns. Also a cute Indian girl for Indians.
The PSL distribution for wearing a backpack. It is only slightly higher for non-wearers.
And finally PSL by gender
In conclusion, the mean PSL was between 3 and 3.5, which was lower than I expected. Disregarding outliers PSL would have been highest in whites but only by a small margin to other ethnicities, of course, I did not include an ethnic tax in my ratings.