


FuckFace5
Iron
- Joined
- Jan 12, 2025
- Posts
- 56
- Reputation
- 43
Graph of facial attractiveness:
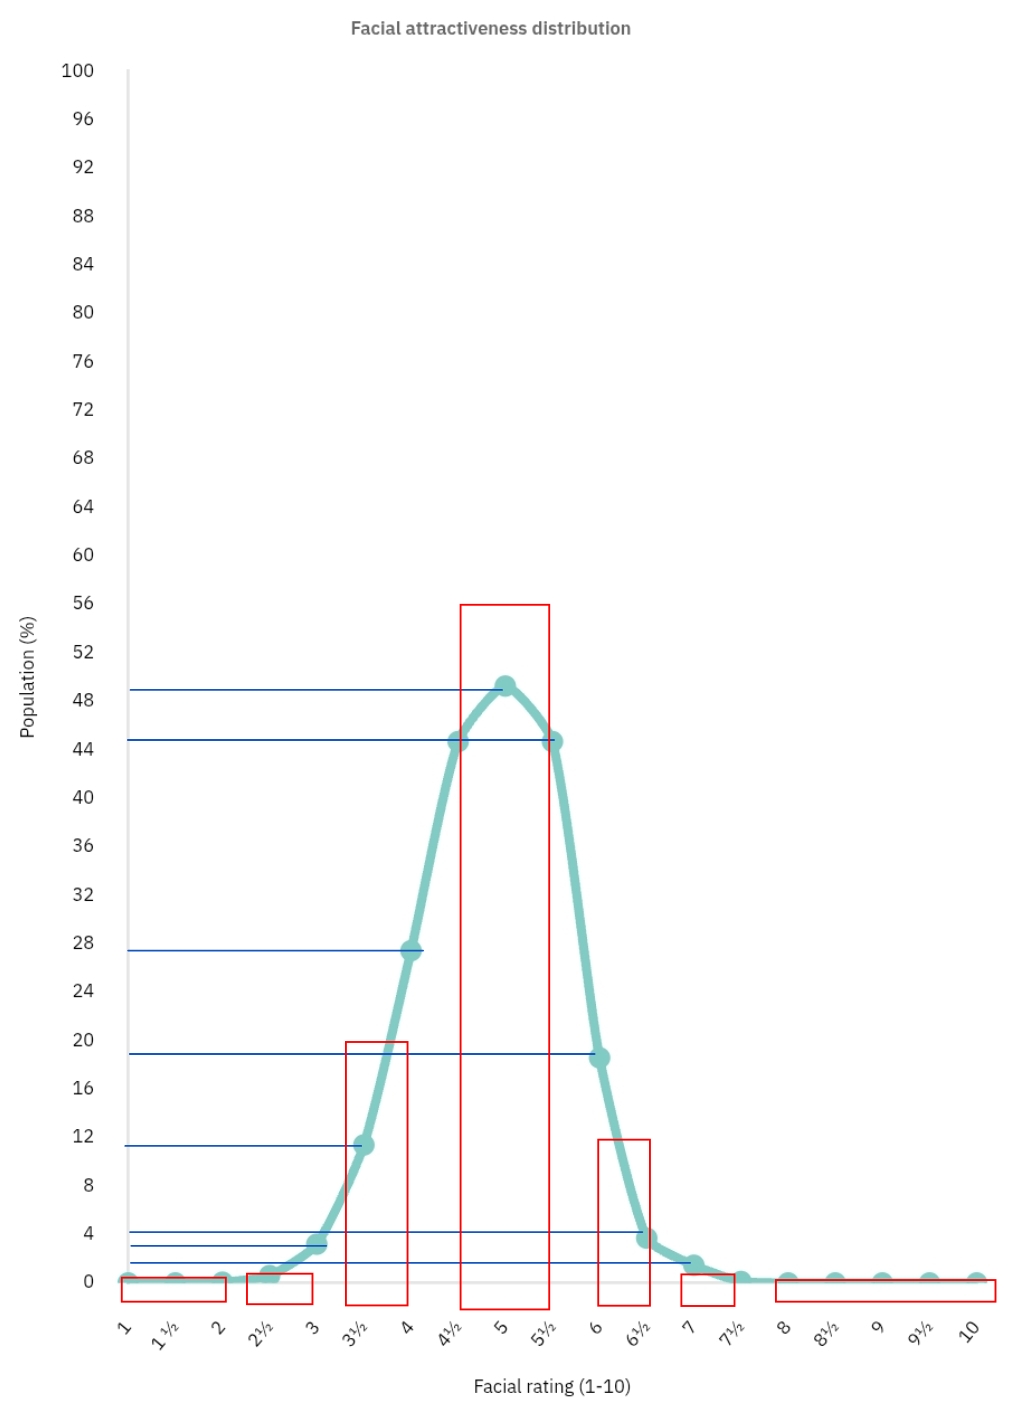
You can see that the big red Square in the middle of the graph is the most common group. These are average looking people and can be considered a 4.5 to a 5.5 out of 10. after that you have the below( 4 to 3.5) and the above average looking people(6 to 6.5). These are way more rare already with above average people being more rare. After that the line just lays completely flat with very rare ratings like 7+ or <2.5
Here is the full list:
The more common numbers like 2.5 to 7.5 should be completely accurate.
You can see that the big red Square in the middle of the graph is the most common group. These are average looking people and can be considered a 4.5 to a 5.5 out of 10. after that you have the below( 4 to 3.5) and the above average looking people(6 to 6.5). These are way more rare already with above average people being more rare. After that the line just lays completely flat with very rare ratings like 7+ or <2.5
Here is the full list:
| Rating (1-10) | rarity (%) | 1 in ? People | class |
| 1 1.25 1.5 1.75 | 0.00% 0.000045% 0.0009% 0.012% | 1/0 1/2.23M 1/111K 1/8341 | extremely Rare |
| 2 2.25 2.5 2.75 | 0.06% 0.21% 0.61% 1.46% | 1/1668 1/478 1/165 1/68 | rare |
| 3 3.25 3.5 3.75 | 3.2% 6.34% 11.39% 18.55% | 1/31 1/16 1/9 1/5 | Fairly rare |
| 4 4.25 4.5 4.75 | 27.42% 36.75% 44.68% 49.26% | 1/3.5 1/2.7 1/2.3 1/2 | Common |
| 5 5.25 5.5 5.75 | 49.68% 44.68% 36.75% 27.42% | 1/2 1/2.3 1/2.7 1/3.5 | Common |
| 6 6.25 6.5 6.75 | 18.55% 8.1% 3.7% 2.03% | 1/5 1/12 1/27 1/50 | Fairly rare |
| 7 7.25 7.5 7.75 | 1.46% 0.62% 0.12% 0.0147% | 1/68 1/164 1/822 1/6802 | rare |
| 8 8.25 8.5 8.75 | 0.0013% 0.000082% 0.000003% 1.3 x 10-⁷ | 1/76923 1/1.2M 1/60M 1/100M+ | Extremely rare |
| 9 9.25 9.75 10 | N/A N/A N/A 0.00% | 1/500M+ 1/2B+ 1/7B+ 1/0 | Exceptionally Rare |
The more common numbers like 2.5 to 7.5 should be completely accurate.


